
Can We Predict Paper Machine Breaks Using Machine Learning?
Exploring rare-event detection, industrial time-series data, early-warning systems, and the limits of predictive maintenance in paper manufacturing.
Can historical machine and process measurements help identify paper breaks—and, more importantly, can they provide a useful warning before a break happens?
This investigation explores that question using the ProcessMiner paper-machine dataset. The results show why detecting an event as it occurs is a different problem from predicting it in advance.
1. Introduction: Why Does This Problem Matter?
Paper manufacturing is a complex industrial process involving interconnected machines, process variables, material conditions, and operating parameters. When a paper break occurs, production can be interrupted and operators may need to intervene before the machine returns to normal operation.
This creates an important opportunity for data-driven manufacturing. If historical sensor measurements contain useful patterns associated with a break, machine learning may help operators detect abnormal conditions, monitor process behaviour, or investigate potential warning signals.
However, industrial prediction is rarely as simple as training a model and reporting its accuracy. Breaks are relatively rare, sensor measurements can be highly correlated over time, and patterns observed during an event may not appear early enough to prevent it.
We therefore approached this as an investigation rather than assuming that machine learning would automatically provide a reliable predictive-maintenance solution.
2. What Led Us to This Research?
The motivation came from a broader question in Industry 4.0: industrial systems generate substantial amounts of operational data, but how much of that data can be converted into useful information for decision-making?
Research on digital transformation in the pulp-and-paper industry discusses challenges such as fragmented data, legacy systems, inconsistent data quality, and incomplete integration between industrial systems. Other research explores the use of AI, process data, digital twins, and predictive maintenance to improve industrial monitoring and optimization.
These developments led us to a more focused question. Instead of attempting to optimize an entire paper mill, could we investigate one specific operational event using historical process measurements?
Paper breaks offered a useful case study because they represent a clearly labelled event that can be investigated using time-series data.
We wanted to answer four questions:
- Can a machine-learning model distinguish break observations from normal operation?
- Which process variables are associated with break observations?
- Can the model identify a break several minutes before it occurs?
- How does detection performance change when we account for false alarms and future data?
These questions shaped the experiment and its evaluation. A model that recognizes an event at the moment it occurs may still be unsuitable for an early-warning system. Understanding that distinction was a central objective of the analysis.
3. Research Background and Related Work
Our investigation sits within the broader field of industrial analytics, where sensor data and machine-learning methods are used to study process behaviour, monitor equipment, and support operational decisions.
Digital transformation in paper manufacturing
Digital transformation involves more than installing sensors or automating individual machines. Industrial data must also be accessible, consistent, and connected to the decisions people need to make.
Read: Digital Transformation in the Paper Industry (2025)
AI and process optimization
AI and predictive analytics can help investigate industrial time series, identify recurring patterns, and support the monitoring of complex processes. Their usefulness depends on data quality, appropriate evaluation, and the operational context in which predictions will be used.
Read: AI and Sustainable Energy Management in Pulp and Paper (2025)
Digital twins and smart manufacturing
Digital-twin approaches connect digital representations of physical processes with operational data. This is part of the wider movement toward data-informed monitoring and manufacturing optimization.
Read: Intelligent Digital Twin System for Paper Manufacturing (2023)
Time-series analysis and predictive maintenance
Time-series methods are particularly relevant when measurements are recorded sequentially. They make it possible to study how process variables evolve before, during, and after an event, rather than treating every row as an independent observation.
Read: Data Analysis for Predictive Maintenance Using Time Series and Deep Learning
These publications provide background and motivation for industrial analytics. They should not be interpreted as independent validation of the particular model developed in this investigation.
4. Dataset: What Did We Analyze?
The investigation uses the ProcessMiner paper-machine dataset, a multivariate time series containing anonymized process measurements and labels identifying paper-break events.
| Dataset characteristic | Value used in this analysis |
|---|---|
| Total observations | 18,398 rows |
| Process variables | 61 |
| Break observations | 124 |
| Break prevalence | Approximately 0.67% |
| Observation period | 1–29 May 1999 |
| Nominal sampling interval | Approximately two minutes |
| Chronological held-out test set | 33 break observations |
The low frequency of break observations is particularly important. Most rows represent normal operation, while only a small fraction contain a labelled break.
In this setting, a model could appear highly accurate simply by predicting that a break never happens. For this reason, evaluation must consider whether the model actually identifies break events and how many false alarms it generates.
Download the dataset
Access the ProcessMiner dataset on Figshare
Visit the dataset page to inspect its description, available files, licence, and download options.
Readers should confirm that the downloaded file corresponds to the exact dataset version used in the experiment.
Related research paper
Read the related paper on rare-event prediction in production
This provides additional context for the challenge of classifying rare events in manufacturing data.
5. Understanding the Class Imbalance
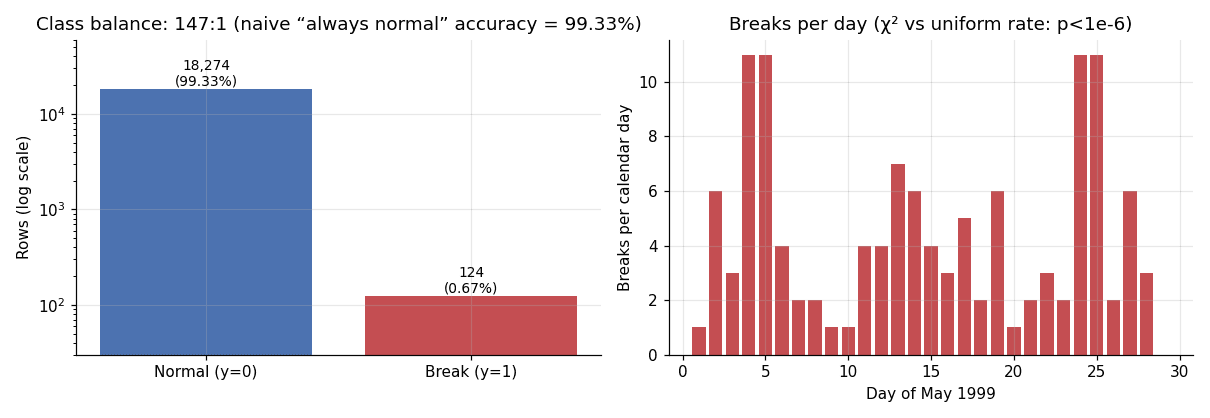
One of the first things we examined was the distribution of break events. Out of 18,398 observations, only 124 were labelled as breaks. This represents approximately 0.67% of the dataset.

Figure 1. Dataset class balance and distribution of break events across the observation period. Replace this image URL with the uploaded chart URL.
This imbalance changes how the problem should be evaluated. Overall accuracy alone is not enough. Precision, recall, precision-recall area under the curve (PR-AUC), and false-alarm frequency provide more useful information about the model's performance on rare events.
6. How Were Breaks Distributed Over Time?
We examined the chronological distribution of breaks to understand when events occurred and how process measurements behaved around them.

Figure 2. Break events over time, with the process variable x3 highlighted at break observations. This plot helps visualize event timing and associated measurements; it does not establish causation.
The time-series view helps distinguish two questions: what measurements look like when a break occurs, and whether those measurements provide a dependable signal before the event. Those are related but different tasks.
7. Methodology: How Did We Approach the Problem?
Step 1: Treat breaks as a rare-event classification problem
The first task was to determine whether a machine-learning model could distinguish observations labelled as breaks from the much larger number of normal observations.
Step 2: Preserve chronological order for evaluation
Time-series observations recorded close together can be strongly correlated. Randomly distributing neighbouring rows across training and testing can therefore produce an overly optimistic estimate of how well a model generalizes to future operation.
We evaluated the model using a chronological holdout, training on earlier observations and evaluating on a later period. The held-out test period contained 33 break observations.
Step 3: Evaluate precision and recall
Precision measures the proportion of predicted break events that are genuine break observations. Recall measures the proportion of actual break observations that the model detects.
Raising the alert threshold can reduce false alarms but may cause the model to miss more breaks. Lowering it can detect more events while increasing the number of unnecessary alerts.
Step 4: Investigate early-warning horizons
Finally, we investigated whether process measurements could provide useful signals at different lead times before a break. This is operationally more demanding than detecting a break at the moment it occurs.
8. Model Performance: Can We Detect Breaks?
The random-forest model achieved a PR-AUC of 0.483 for at-break detection in the reported experiment, compared with a break prevalence of approximately 0.9% in the relevant training/evaluation baseline described in the analysis.
The important distinction is that the model was evaluated on a later chronological period. Its results should not be interpreted as proof that the same performance would be achieved in another mill, on another machine, or under different operating conditions.

Figure 3. Precision-recall curves comparing model performance and the rare-event baseline. A higher PR-AUC can indicate better ranking of rare positive events, but practical performance still depends on the alert threshold.
Why false alarms matter
An industrial alert system must do more than detect events. If it raises too many false alarms, operators may struggle to distinguish meaningful warnings from routine noise.
The reported operating points illustrate this trade-off:
- One threshold detected 14 of the 33 held-out breaks at approximately 0.8 false-alarm clusters per operating day.
- A more aggressive threshold detected 21 of the 33 held-out breaks at approximately 4.5 false-alarm clusters per operating day.
These are different operating points, not contradictory results. A higher detection rate came with a greater false-alarm burden. Whether either setting is useful depends on the cost of a missed break, the cost of an unnecessary alert, and the operator's ability to respond.
9. Can We Predict a Break Before It Happens?
Detecting a break at the moment it occurs does not necessarily mean the model can predict it early enough for an operator to intervene.
A genuine early-warning system must identify useful signals before the event. It should also provide enough lead time for the warning to be acted upon.

Figure 4. Event-aligned process measurements around break observations. The chart shows how selected variables behave near events; it should not be interpreted as evidence that every visible change is a reliable precursor.
In the reported experiment, early-warning performance was substantially weaker than at-break detection:
| Prediction horizon | Reported PR-AUC | Interpretation |
|---|---|---|
| At-break detection | 0.483 | Detecting observations associated with a break. |
| 2 minutes ahead | 0.033 | Very weak early-warning performance. |
| 4–20 minutes ahead | 0.054–0.214 | Performance varied by horizon and remained challenging, with false alarms to consider. |

Figure 5. Early-warning performance across prediction horizons and the associated false-alarm trade-off. A useful operational system must balance lead time, detection rate, and alert burden.
The main lesson is that the ability to recognize a break around the time it occurs is not equivalent to predicting it several minutes in advance. The early-warning results suggest that stronger evidence and better process context would be needed before claiming that the model can reliably prevent breaks.
10. What Do the Process Variables Tell Us?
Feature-importance analysis can help identify variables that contribute to the model's predictions. However, importance scores describe the model's use of information; they do not establish the physical cause of an industrial event.

Figure 6. Grouped permutation feature importance. The results indicate which groups of measurements were useful to the fitted model under the evaluation procedure. Correlated variables and anonymized sensor names limit physical interpretation.
The analysis also showed a sharp fall in x2 and x3 at break observations. This is an interesting association worth investigating, but it does not prove that either variable causes a break or changes early enough to prevent one.
To establish a plausible mechanism, we would need the physical meaning and units of the sensors, confirmed event timing, operational logs, and input from people familiar with the machine and its process.
11. Why Chronological Testing Matters
A model can appear more successful when training and test data contain observations recorded very close together in time. Such observations may share similar operating conditions, making the test set less independent than it first appears.
In this experiment, shuffled splits produced PR-AUC values around 0.63–0.64, while the reported chronological evaluations were lower, around 0.33–0.41 in the relevant comparisons.
This gap highlights the importance of testing on later observations when the intended application is predicting future industrial events.

Figure 7. Rolling-origin evaluation results compared with the rare-event baseline. Use this chart to examine how performance varies across chronological folds.
A single chronological split is useful, but it cannot fully establish robustness across different production conditions. Additional time periods and independent datasets would be needed to test whether the results remain stable.
12. Data Gaps and Operational Context
The dataset contains gaps longer than the nominal two-minute sampling interval. In the reported analysis, 107 such gaps were identified, and 103 occurred immediately after a break.
These patterns may be consistent with interruption or restart behaviour, but the available data does not confirm the operational explanation for each gap. We should therefore treat restart interpretations as hypotheses rather than established facts.
The analysis also found that 19 of the 124 break observations occurred within the first ten rows of a segment, compared with 5.3% of all rows. Break rates also differed across paper types, including paper type 96 in the exploratory analysis.
These observations can help generate hypotheses for further study. They do not, on their own, demonstrate that segment starts or a particular paper type cause breaks.
13. What Are the Limitations?
The results need to be interpreted in light of several limitations:
- Rare events: Only 124 of the 18,398 observations were labelled as breaks.
- Limited time period: The dataset covers a relatively short period in May 1999.
- Anonymized variables: Sensor identities and units are not sufficiently descriptive to establish physical explanations for every association.
- Weak early-warning results: Performance several minutes before a break was substantially weaker than at-break detection.
- False alarms: Increasing the number of detected breaks can also increase the burden on operators.
- Temporal dependence: Nearby observations may be correlated, which can make randomly shuffled evaluations look more optimistic.
- Limited operational records: Additional event, maintenance, downtime, production, and restart logs would help interpret the results.
These results describe patterns and predictive performance in the analyzed dataset. They do not establish causation, prove that a machine-learning model will work in another facility, or demonstrate that the proposed approach is ready for production deployment.
14. What Would We Investigate Next?
The next stage should focus on connecting the statistical patterns to the real manufacturing process.
- Obtain sensor documentation: Identify the physical meaning, units, measurement frequency, and operational significance of each variable.
- Connect confirmed event logs: Compare break timestamps with operator reports, downtime records, and maintenance logs.
- Study operating conditions: Investigate production speed, paper grade, recipe changes, and machine restart behaviour.
- Collect a longer time series: Include more break events and a wider range of production conditions.
- Validate warning lead time: Evaluate whether alerts occur early enough to support a practical intervention, not simply whether the model identifies a break.
- Evaluate operational usefulness: Work with process experts to determine an acceptable trade-off between missed breaks and false alarms.
15. Download the Data and Verify the Research
An important part of research is making it possible for other people to inspect the underlying evidence. The following resources can help readers explore the problem further.
Resource 1 — Dataset
Open the ProcessMiner dataset on Figshare
Use the dataset page to inspect the files and download the available data. Confirm the version and licence before reuse or redistribution.
Resource 2 — Related rare-event research
Resource 3 — Industry research background
For full reproducibility, readers should also have access to the exact preprocessing steps, chronological split, model configuration, evaluation code, and chart-generation code used in this analysis.
If the code has not yet been published, do not imply that a public repository exists. Add a link here once the analysis code is available.
16. Conclusion: Detection Is Not the Same as Prediction
This investigation shows why rare-event detection in industrial time-series data is both promising and challenging. Machine-learning models can identify patterns associated with paper breaks, but the quality of those detections depends on the evaluation method, the alert threshold, and the operational context.
The at-break results were more encouraging than the early-warning results. When we asked whether a break could be predicted several minutes in advance, performance was considerably weaker and false alarms remained an important concern.
The findings also demonstrate why chronological evaluation matters. A model that performs well on randomly shuffled observations may not achieve the same performance when asked to predict later events.
The next step is not simply to build a more complex model. It is to obtain richer process context, validate the signals with industrial experts, and test the approach on additional data.
Useful industrial AI requires more than a high performance score. It requires trustworthy data, realistic evaluation, interpretable evidence, manageable false alarms, and predictions that arrive early enough to support a decision.
Research Transparency
This article reports an exploratory analysis of a historical industrial dataset. Results depend on the dataset, preprocessing, model configuration, and evaluation procedure used in the experiment.
Observed associations should not be interpreted as causal relationships. The analysis does not establish that the model can prevent paper breaks or generalize to other manufacturing facilities without further validation.
Dataset and reference links are provided for readers who wish to examine the source material. Verify bibliographic details, data version, and reuse permissions before citing or redistributing these resources.
